
The Question
Texas is a nation. A narrower question follows, one any serious study of independence has to answer: does Texas have the economic capacity of a country? The answer below rests only on official data. Each figure carries its source and its period, and every figure was retrieved on October 13, 2026. Where a measure has limits, the limits are stated.
| Measure | Figure | Period | Source |
|---|---|---|---|
| Nominal GDP | $2.932 trillion | 2025, current dollars | BEA |
| Real GDP | $2.335 trillion | 2025, chained 2017 dollars | BEA |
| Population | 31,709,821 | July 1, 2025 | Census Bureau |
| Labor force | 15,932,639 | August 2026, preliminary | BLS |
| Goods exports | $450.3 billion | 2025 | Census Bureau |
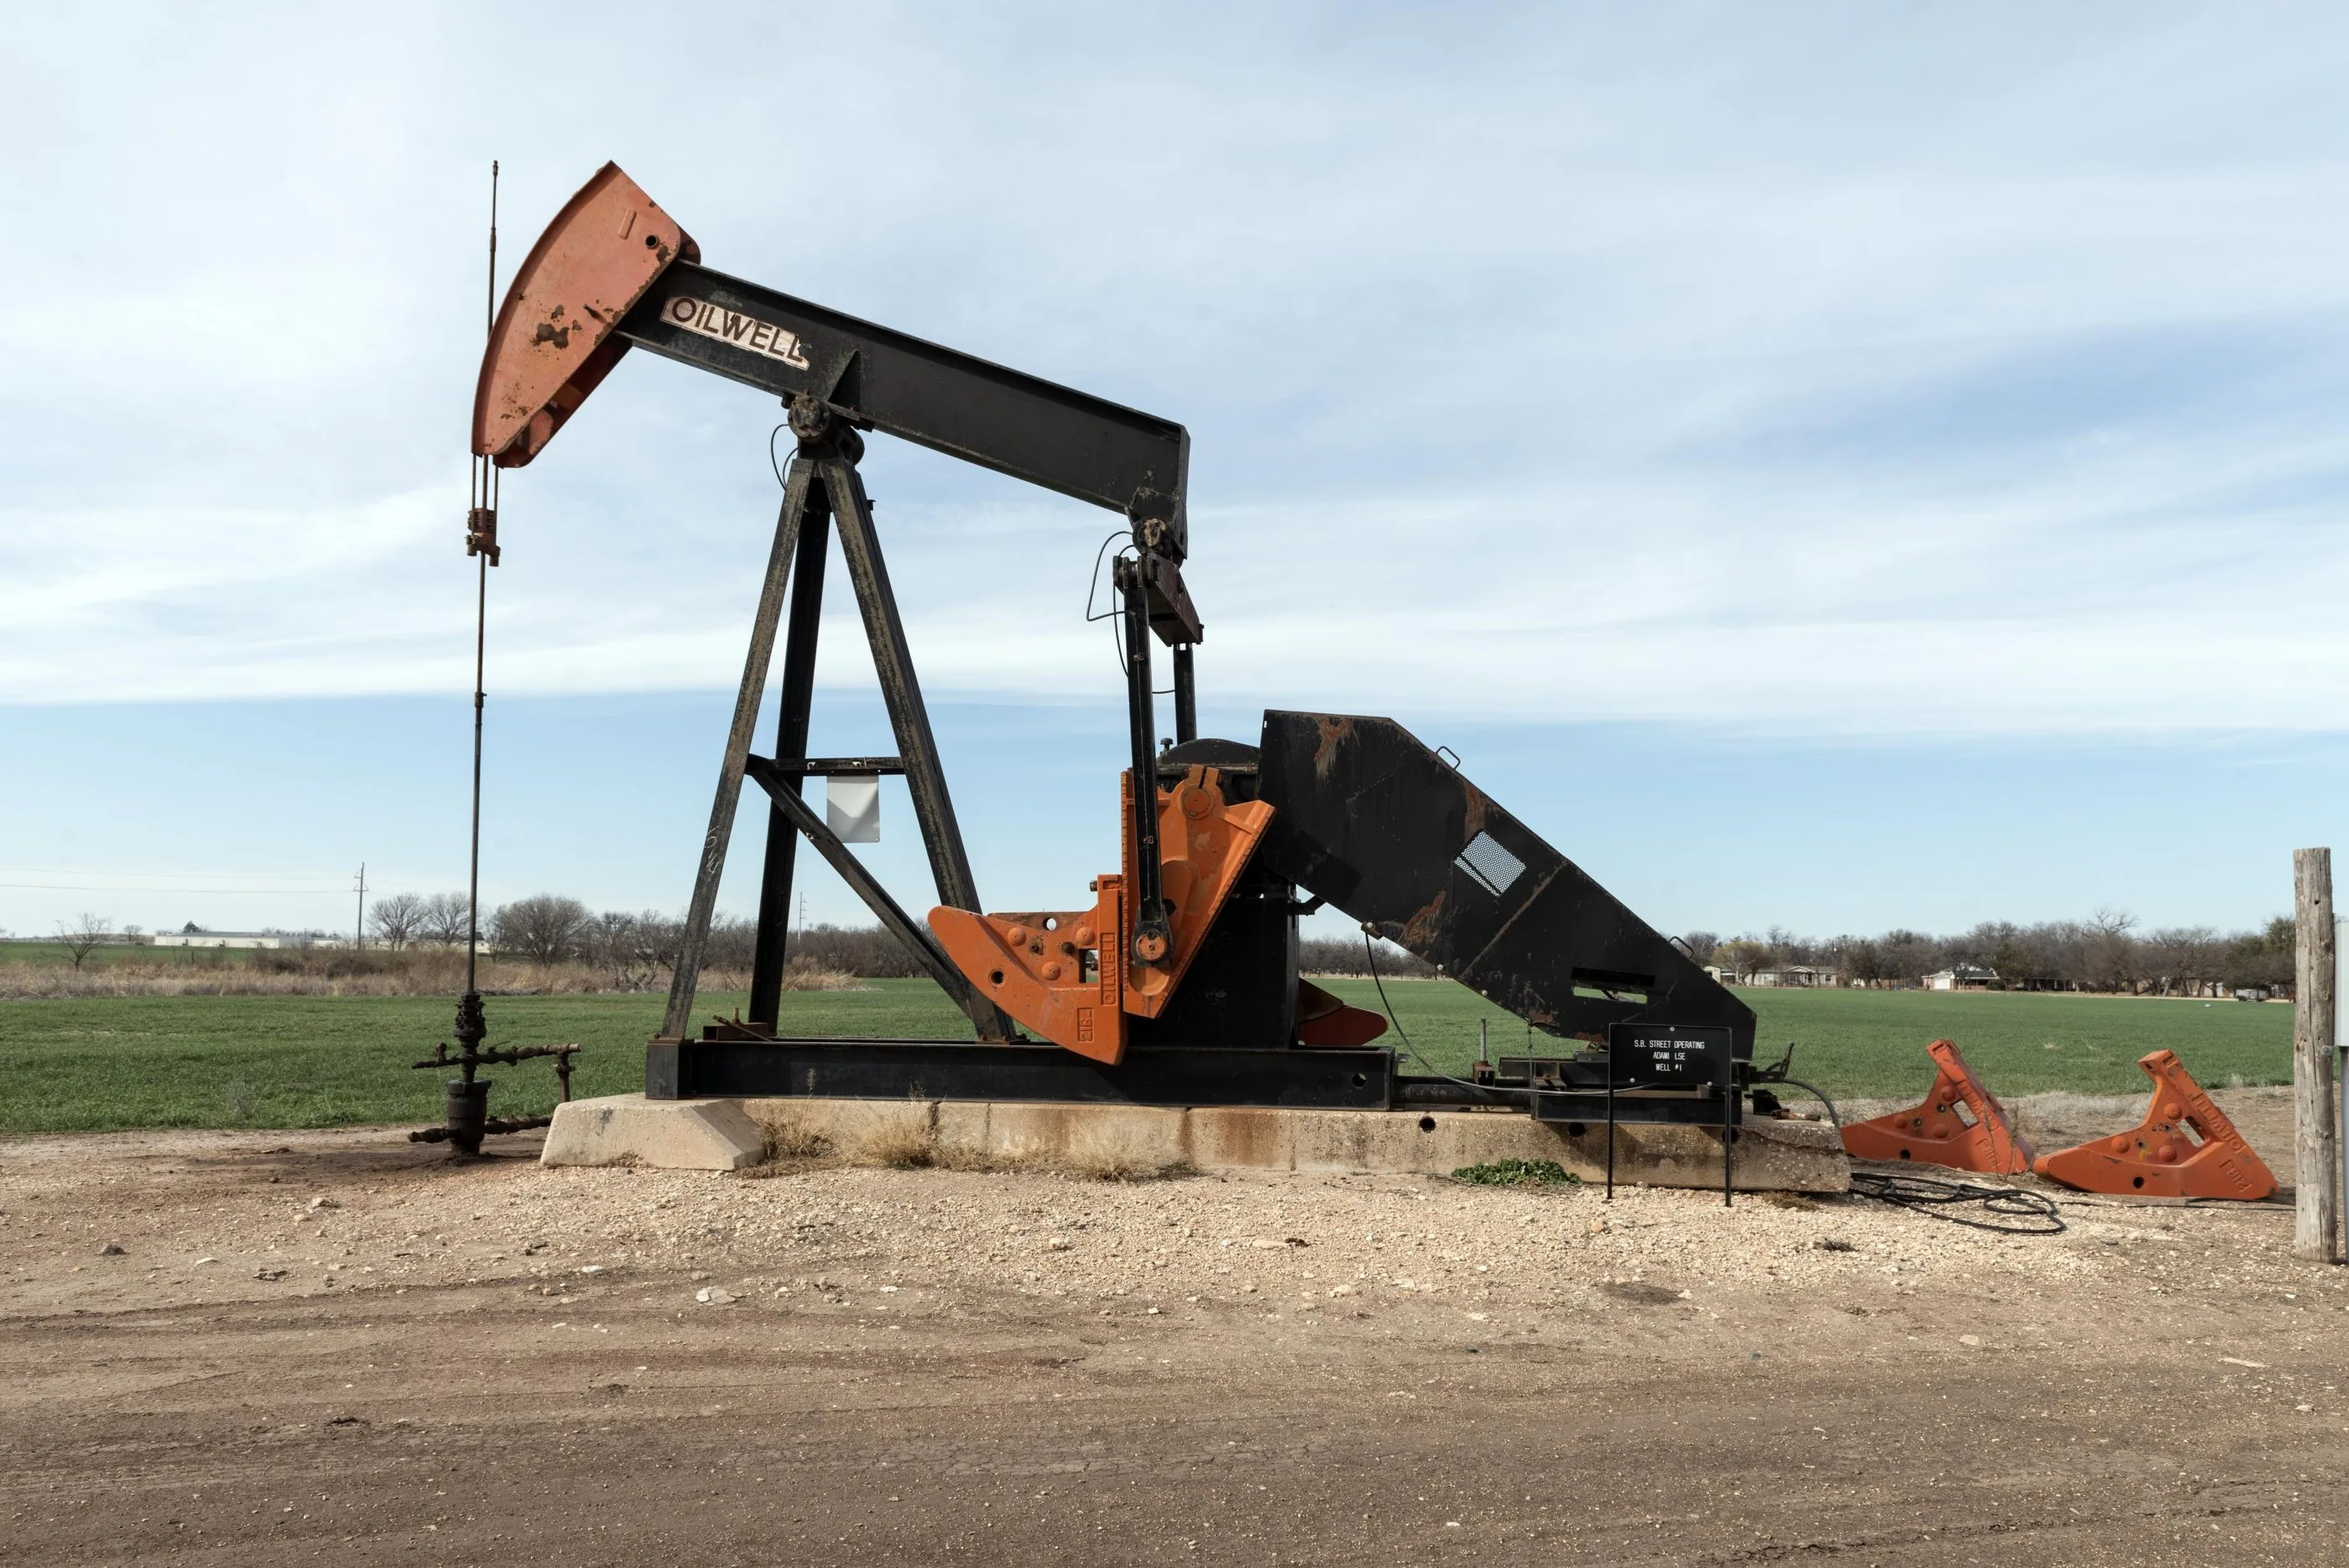
| Crude oil | 5,761,000 barrels per day | 2025 | EIA |
| Natural gas (marketed) | 12,656,556 million cubic feet | 2025 | EIA |
| Electricity generated | 566,502,688 megawatthours | 2024 | EIA |
Output
The U.S. Bureau of Economic Analysis (BEA) measures each state's gross domestic product. In its revision of September 30, 2026, BEA put Texas GDP for 2025 at $2,932.3 billion in current dollars. Only California was larger. Measured in chained 2017 dollars, which remove the effect of price changes, Texas output was $2,334.6 billion.
Real output grew faster in Texas than in the country as a whole. BEA's chain-type quantity index for Texas rose 2.8 percent in 2025. The index for the United States rose 2.3 percent. Texas produced 9.5 percent of all U.S. output that year.
How does that compare with countries? The International Monetary Fund's World Economic Outlook database, read through the IMF DataMapper, lists 2025 GDP in current U.S. dollars for each economy. IMF figures for some countries are staff estimates. On that list, seven economies are larger than Texas: the United States (which includes Texas), China, Germany, Japan, the United Kingdom, India, and France. France stands at $3,382.6 billion. The next economies below Texas are Russia, at $2,572.3 billion, and Italy, at $2,550.1 billion. Placed on the IMF list, Texas would rank eighth in the world.
People and Work
The Census Bureau's Vintage 2025 estimates put the Texas population at 31,709,821 on July 1, 2025. Texas is the second most populous state. It added 391,243 residents in the year ending on that date, about 22 percent of the growth of the entire United States.
The Bureau of Labor Statistics reports a seasonally adjusted Texas labor force of 15,932,639 in August 2026, the latest month published. Of those, 15,225,115 were employed. The unemployment rate was 4.4 percent. All three August figures are preliminary and subject to revision.
Trade
Texas leads every state in exports. The Census Bureau's 2025 state export exhibit reports $450.3 billion in Texas goods exports, out of a U.S. total of $2,185.2 billion. That is 20.6 percent of all U.S. goods exports. California was second at $188.4 billion.
The Census Bureau counts exports by "origin of movement," the state where goods begin their trip to the border or port. Some goods produced elsewhere are credited to Texas because they leave the country through Texas. The figure measures trade that runs through the Texas economy, not only goods made in Texas.
Energy
The U.S. Energy Information Administration (EIA) publishes annual production by state. Its releases of September 30, 2026, cover 2025.
- Crude oil. Texas produced 5,761,000 barrels per day in 2025, 42.2 percent of the U.S. total of 13,662,000. New Mexico was second at 2,205,000.
- Natural gas. Texas marketed production was 12,656,556 million cubic feet in 2025, 29.3 percent of the U.S. total. Pennsylvania was second at 7,675,792.
Electricity data run a year behind. EIA's Texas electricity profile, released November 10, 2025, reports 566,502,688 megawatthours of net generation in 2024, first among the states. Retail sales in Texas that year were 505,431,317 megawatthours.
The Grid
Most of Texas runs on its own electric grid. The Electric Reliability Council of Texas (ERCOT) states that it serves more than 27 million Texas customers, about 90 percent of the state's electric load, under the oversight of the Public Utility Commission of Texas and the Texas Legislature.
EIA reported in 2023 that ERCOT "only has four relatively small transmission connections to other grids" and depends more on its own generation than other grids do. That separation has a legal effect. A Federal Energy Regulatory Commission report from 2000 explains that FERC's jurisdiction over ERCOT "is limited because the ERCOT system is isolated from the rest of the nation's power grid." Under the Federal Power Act, FERC lacks jurisdiction over transmission used only in intrastate commerce, with exceptions the report lists, including the interconnections themselves.
State Finances
The Legislative Budget Board reports that the General Appropriations Act for the 2026-27 biennium authorizes $338.2 billion in all funds. That total excludes $283.1 million appropriated in a later special session.
The Texas Comptroller's Certification Revenue Estimate of October 14, 2025, found $203.63 billion in General Revenue-related funds available for the biennium, against general-purpose spending of $198.97 billion. That leaves a projected ending balance of $4.66 billion.
The Economic Stabilization Fund, the state's reserve, reached its constitutional cap at the start of fiscal 2026. The Comptroller projects an ending balance of $28.48 billion for fiscal 2027.
Texas carries these finances without a personal income tax. Article 8, Section 24-a of the Texas Constitution, added November 5, 2019, states that "the legislature may not impose a tax on the net incomes of individuals." Section 24-b, added November 4, 2025, bars a tax on an individual's capital gains.
The Federal Balance
Three published measures describe the money that moves between Texans and Washington. They answer different questions.
The first is collection. The IRS Data Book for fiscal year 2025 reports gross collections of $479.5 billion from Texas. Only California paid more. Texas accounted for 9.0 percent of all IRS gross collections. The IRS assigns collections by the filer's address, and for businesses by the principal office, so a company headquartered in Texas is counted in Texas even when it earns income elsewhere. The figure includes penalties and interest.
The second is the balance of payments. The Rockefeller Institute of Government allocates federal receipts and spending to each state. Its 2025 report covers federal fiscal year 2023. It estimates $378.6 billion in federal receipts from Texas and $458.6 billion in federal spending in Texas, a positive balance of $80.0 billion. Texas received $1.21 for each dollar sent. The 50-state average was $1.32.
The method explains that result. The Rockefeller measure counts all federal spending, including spending paid for with borrowed money. In fiscal 2023, the report shows federal receipts of $4,440.9 billion and federal expenditures of $6,134.7 billion, a deficit of $1,693.7 billion. When Washington spends far more than it collects, nearly every state shows more spending than receipts. The report found only three states with a negative balance that year. The measure also counts direct payments to individuals, such as Social Security and Medicare, in the state where each recipient lives. Those payments made up $3,418.9 billion of the $5,730.9 billion in spending the report allocated to states.
A share comparison removes the deficit from the picture. Using the report's own totals, Texas supplied 8.8 percent of allocable federal receipts and received 8.0 percent of allocable federal spending. Texas paid a larger share of what Washington collects than it received of what Washington spends.
The third is net contribution. USAFacts compares the federal taxes each state's residents pay with the federal money that comes back. For fiscal year 2024 it found that Texas sent Washington $68.1 billion more than it received. "The largest gaps were in California ($275.6 billion), New York ($76.5 billion), and Texas ($68.1 billion)." Texas supplied 8.2 percent of the $5.07 trillion in federal revenue that year. Can Texas Make It? (Texas Nationalist Movement, 2026) explains why the two measures point in opposite directions: the Rockefeller method counts money Washington borrowed, and Texans' own Social Security and Medicare benefits, as spending received by Texas. Treat the borrowing as a deferred tax, and Texas sends Washington more than it gets back.
What the Numbers Establish
The official record supports a plain conclusion. Texas has an output larger than all but seven of the world's economies. It has a population above 31 million and a labor force near 16 million. It leads every state in exports, crude oil, natural gas, and electricity. It operates most of its power system on a grid it governs itself. It funds a $338.2 billion biennial budget without a personal income tax and holds a reserve fund at its constitutional cap. These are the measures of a country's economic base, and Texas meets them.
What the Numbers Do Not Settle
Capacity is not a budget. A Texas government would take on duties that Washington now performs and pays for. Among them are defense, customs and border control, a currency or monetary arrangement, and the Social Security and Medicare benefits Texans have earned. It would also face the question of what share, if any, of the federal debt it would assume. The federal spending in Texas counted above would stop, and federal taxes paid by Texans would stop with it. Can Texas Make It? prices those obligations. Taking Texans' federal and state taxes against the full cost of governing Texas, averaged over 2019 to 2024, it finds that Texas lands "within roughly 30 billion dollars of break-even on its current government functions, at current tax levels." The report claims self-sufficiency, not a surplus, and it sets out its arithmetic, its treatment of Social Security, and its range for any share of the federal debt in the open at cantexasmakeit.com.
Sources
- U.S. Bureau of Economic Analysis, SAGDP1 State Annual GDP Summary (revised September 30, 2026)
- U.S. Bureau of Economic Analysis, GDP (Third Estimate), Industries, Corporate Profits, State GDP, and State Personal Income, 2nd Quarter 2026 (September 30, 2026)
- International Monetary Fund, World Economic Outlook database via IMF DataMapper, GDP, current prices (NGDPD)
- U.S. Census Bureau, Vintage 2025 State Population Totals (NST-EST2025-ALLDATA)
- U.S. Bureau of Labor Statistics, Local Area Unemployment Statistics, Texas labor force, seasonally adjusted (LASST480000000000006)
- U.S. Census Bureau, Exhibit 2, Origin of Movement of U.S. Exports of Goods by State, 2025
- U.S. Energy Information Administration, Crude Oil Production by State, Annual (released September 30, 2026)
- U.S. Energy Information Administration, Natural Gas Marketed Production by State, Annual (released September 30, 2026)
- U.S. Energy Information Administration, Texas Electricity Profile 2024 (November 10, 2025)
- U.S. Energy Information Administration, Today in Energy, "Texas power grid met record-breaking demand for electricity during recent heat wave" (July 26, 2023)
- Federal Energy Regulatory Commission, Investigation of Bulk Power Markets: ERCOT (Texas) (November 1, 2000)
- Electric Reliability Council of Texas, About ERCOT
- Texas Comptroller of Public Accounts, 2026-27 Certification Revenue Estimate (October 14, 2025)
- Legislative Budget Board, General Appropriations Act 2026-27 Biennium Fiscal Size-Up, Funding by Article, All Funds
- Texas Constitution, Article 8 (Taxation and Revenue), Sections 24-a and 24-b
- Internal Revenue Service, Data Book 2025, Table 1-5, Gross Collections by Type of Tax and State, Fiscal Year 2025
- USAFacts, Which states contribute the most and least to federal revenue? (November 3, 2025, FY2024 data)
- Texas Nationalist Movement, Can Texas Make It? (2026), The Net Contributor
- Texas Nationalist Movement, Can Texas Make It? (2026), Can Texas Fund Itself?
- Rockefeller Institute of Government, Giving or Getting? New York's Balance of Payments with the Federal Government (2025 report, FFY 2023 data)
Next in The Case of TexasTexas Is a Nation